

Applies to: Lasernet Core 10
This guide is written for a Lasernet Core system administrator. It explains how to use the Lasernet Monitor application.
System administrators can use the Lasernet Monitor to determine the status of processes and form flows within Lasernet Core environments. It can also be used for maintenance tasks such as starting or stopping the service and retrying failed jobs.
Working with Lasernet Monitor
The log generated by the Lasernet 10 service can be viewed in the Monitor window. This can either be the live log for jobs currently being processed or log data saved to your computer for older jobs that have already been processed.
Monitoring Environments
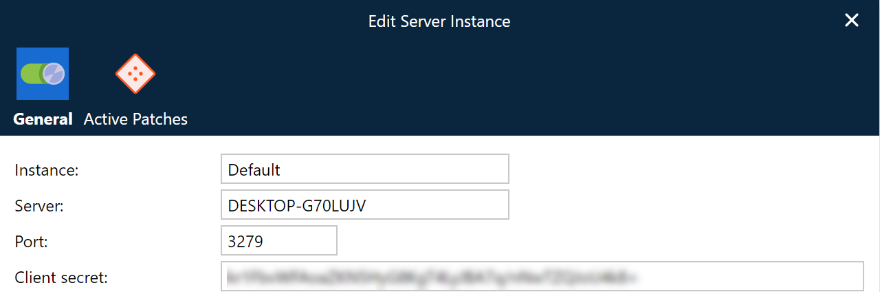
From the Lasernet Monitor you can connect to Lasernet servers in your local network. Communication between the monitor and the Lasernet services is established via an encrypted TCP/IP connection on the port number defined in the Server Instance settings of the Lasernet Config Server.
Note
If the Lasernet Monitor is installed on a different computer than the one running the Lasernet Config Service, ensure that your server’s firewall settings allow the Monitor to connect to the Config Server through the specified port number.
Connect to Lasernet Core
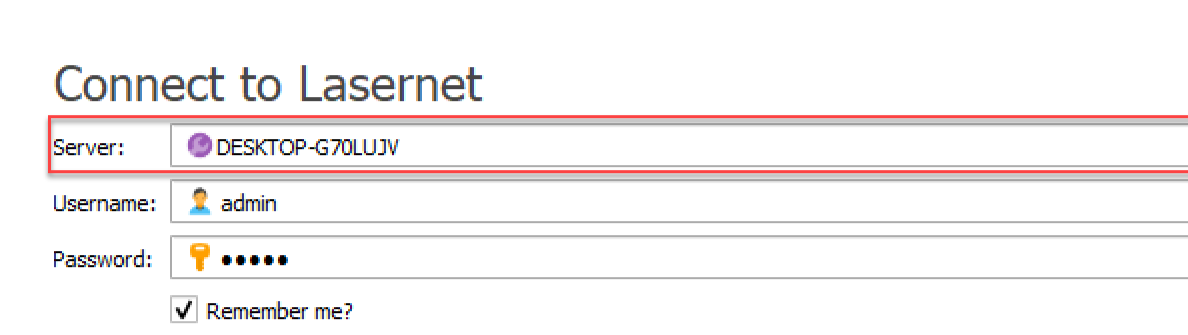
To monitor the server log it is required that you start the Lasernet Monitor, connect to the Lasernet Server with your credentials, select an accessible server in the dropdown in the Connect to Lasernet login screen
and then select an Instance from the Lasernet Monitor application.
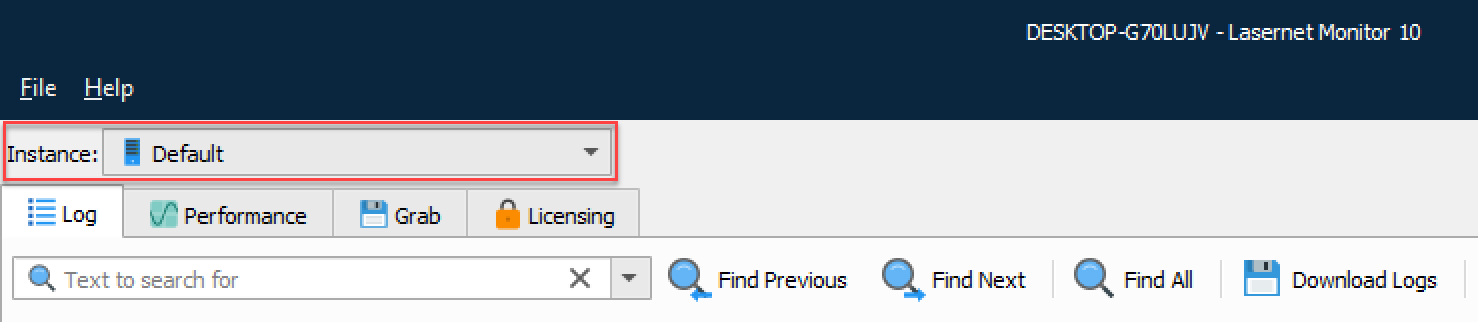
You are now ready to access the monitor log, search for log and fetch oldest and newest messages.
Log
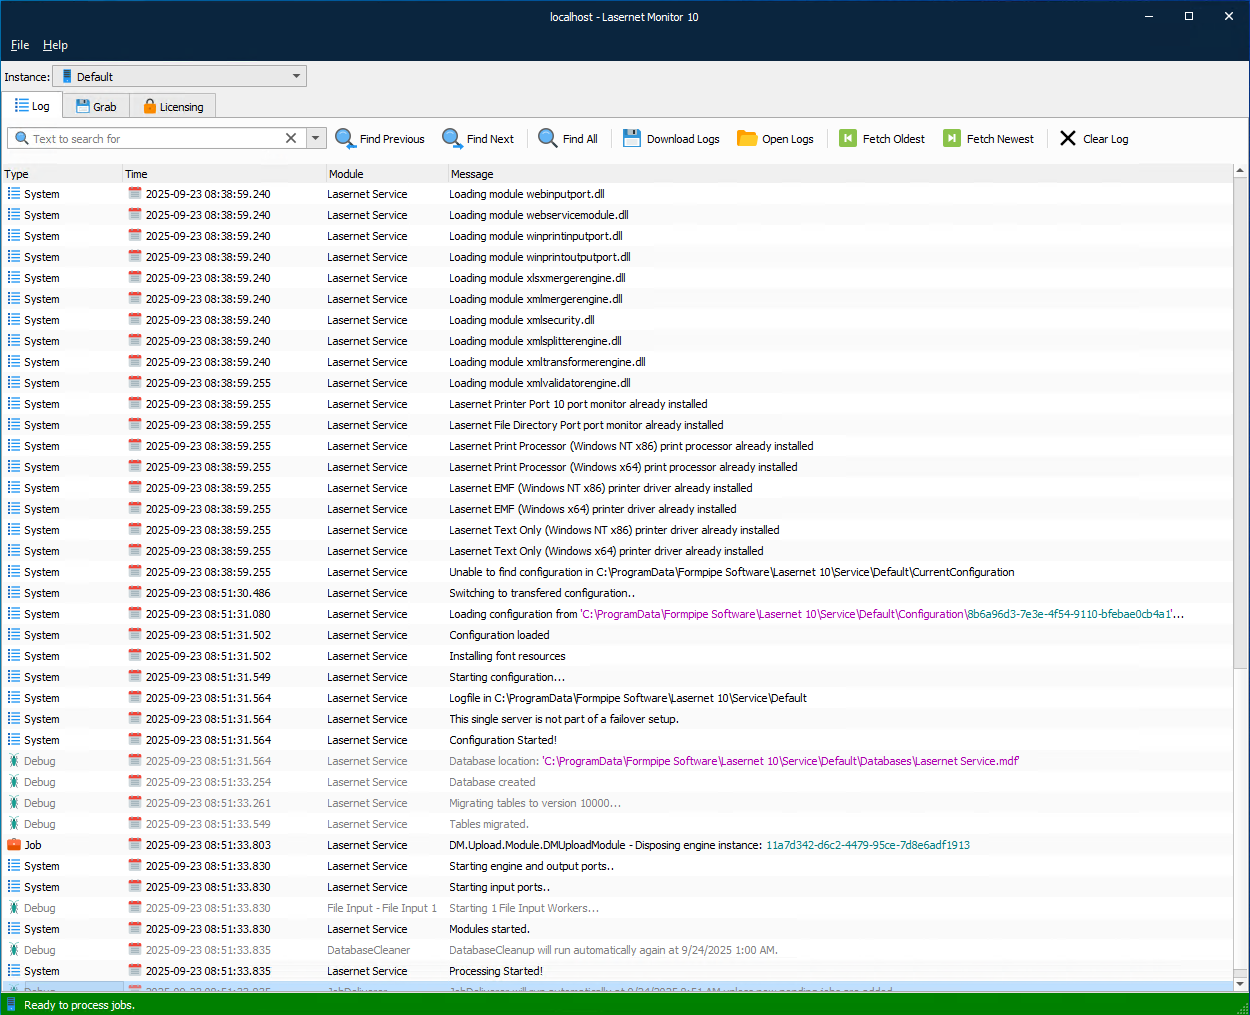
The Log tab displays the log for the selected instance.
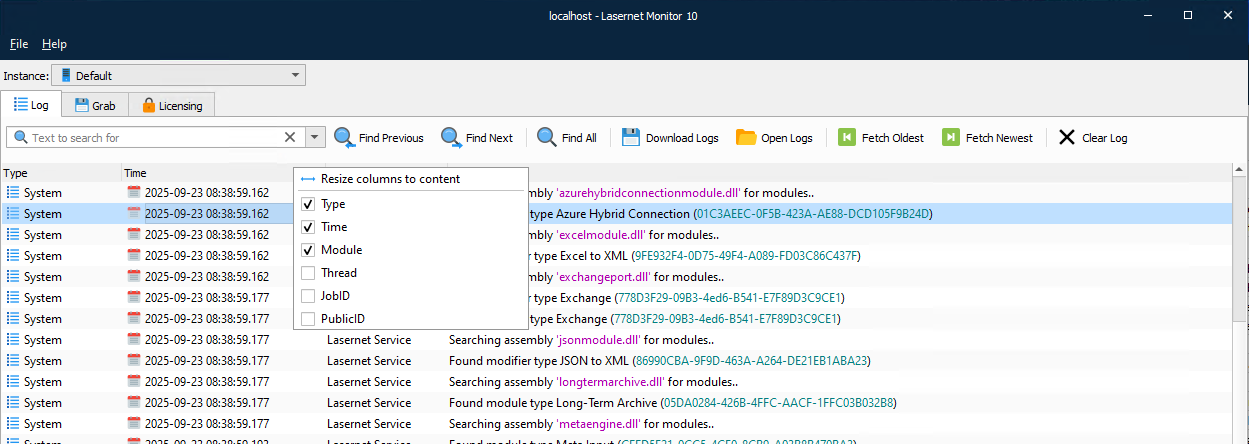
Right-click a row's header to activate the columns you want displayed in the monitor log. Click Resize columns to content to auto-align the size of each column based on the content for each column.
Menu Bar Options
File
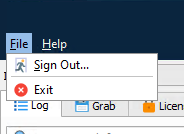
From File in the menu bar, you can either Sign Out or Exit the monitor. More information about these can be found under Toolbar Options.
Help
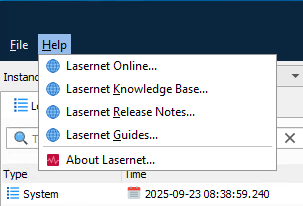
This redirects to the Lasernet site and displays information about the current Lasernet version.
Toolbar Options

Text to Search For
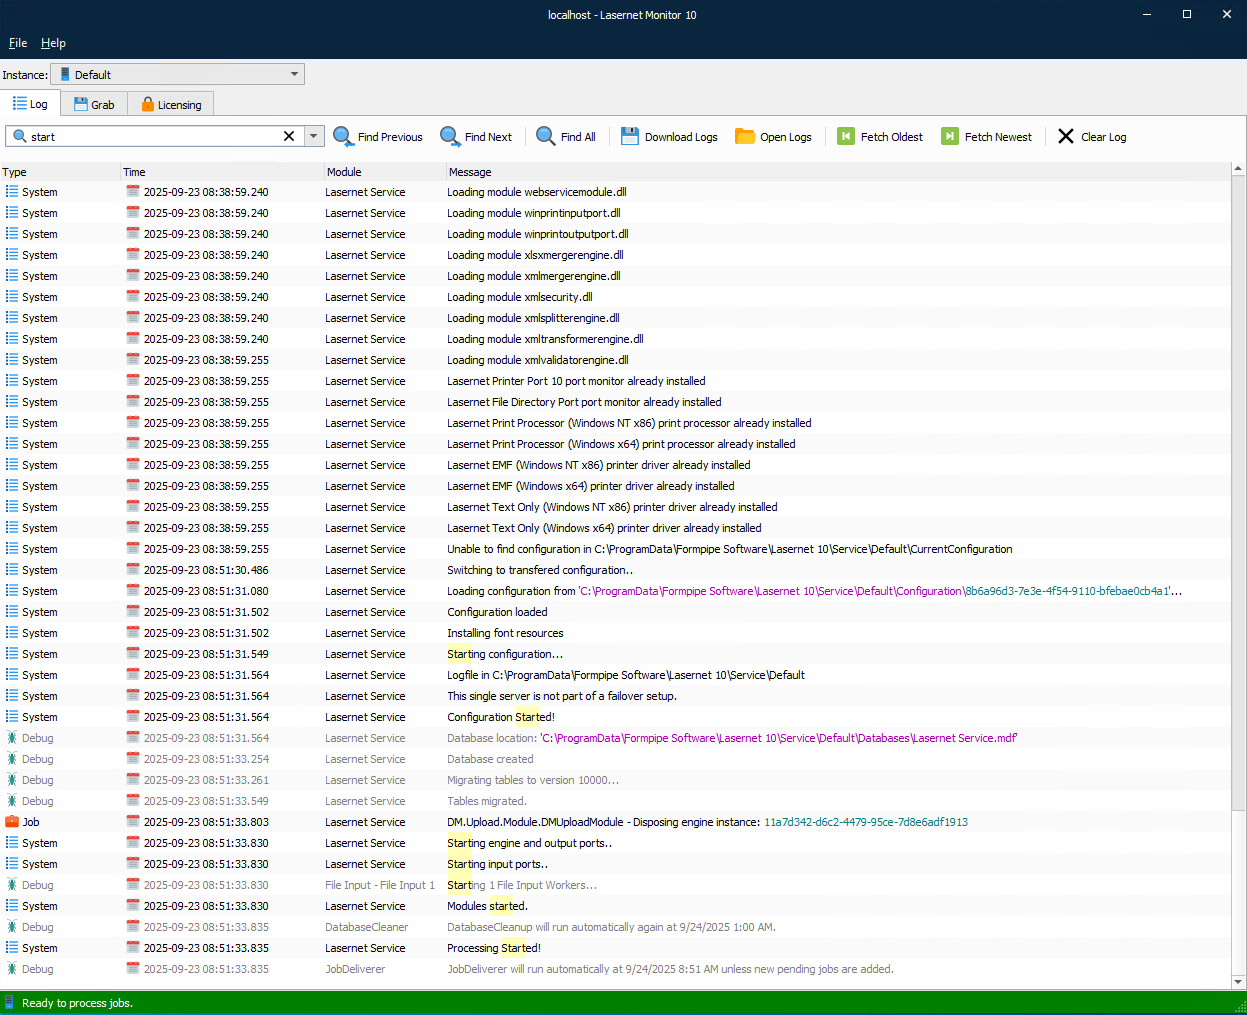
Type a text to search for in the monitor log. Text strings are not case-sensitive. Click x to clear the field.
Find Previous and Find Next
Click Find Previous to scroll to the previously found string in the log. Click Find Next to scroll to the next found string.
Find All
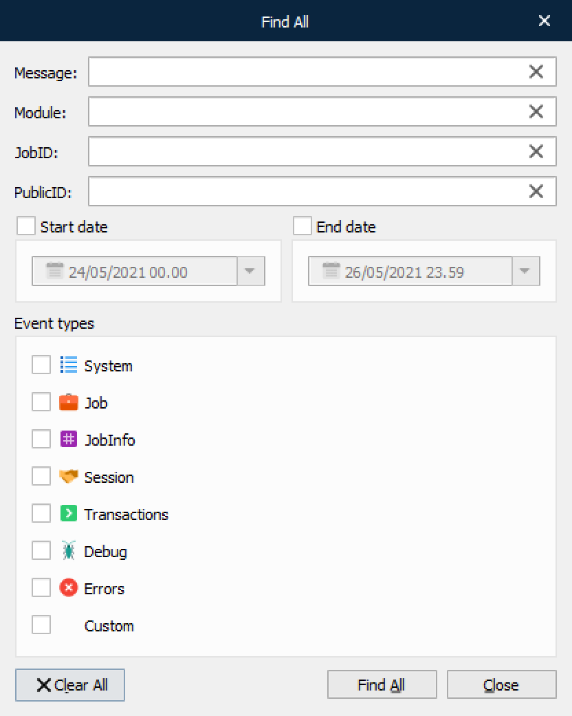
Click Find All for an enhanced search and filter function. A Find All dialog will appear, enabling you to obtain more accurate results.
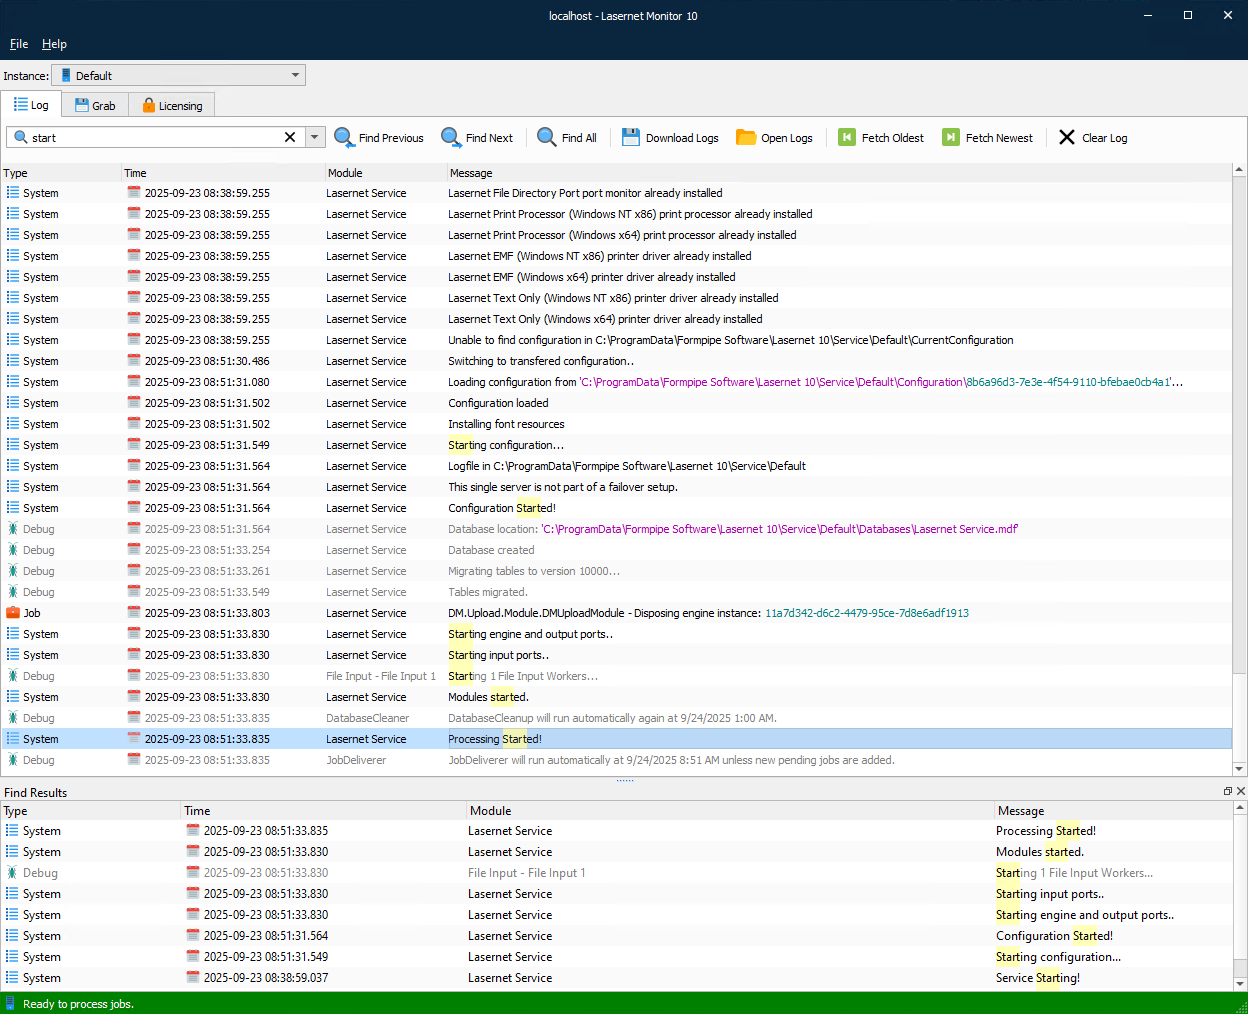
Click Find All in the Find All dialog. A lower pane displays all the found results sorted, with the newest log entries first in the list. Double-click on a line in the lower pane to bring focus to the log message in the upper pane.
To filter the find results in the lower pane, type any message, module name, JobID and/or PublicID that may occur in the log. You can also specify a start date and/or end data to filter the find results or select to show specific type of events.
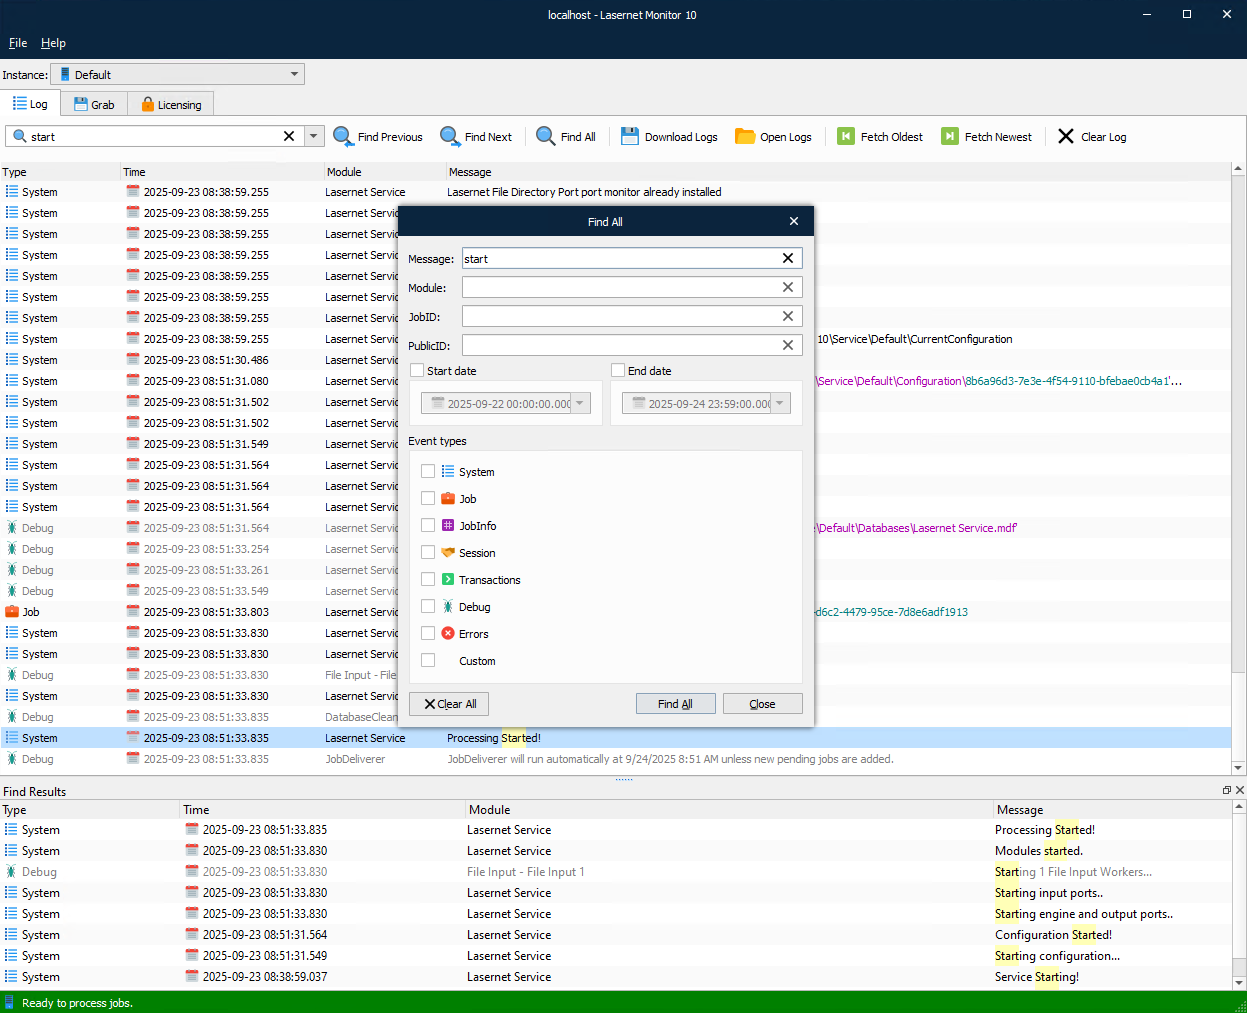
Click Clear All to reset the values entered in the Find All dialog.
Download Logs
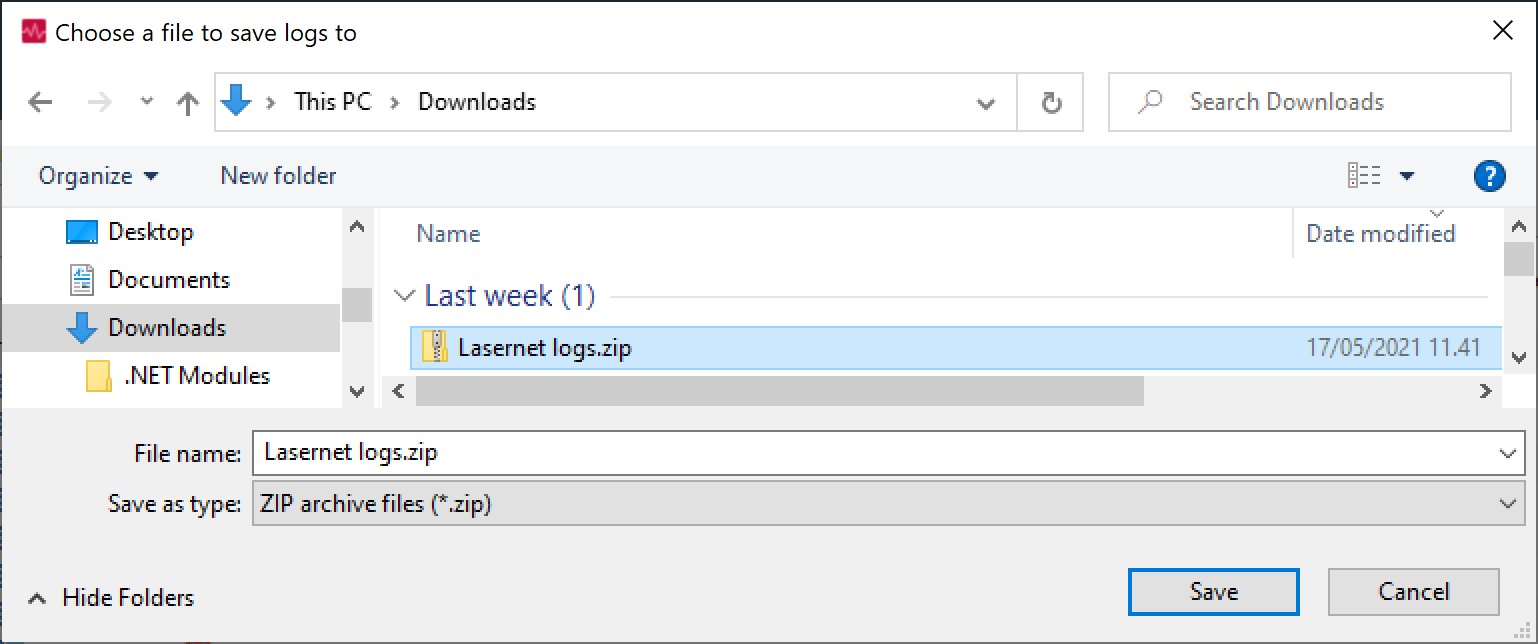
This tool will download the log files from the server/instance to the local computer as a zip file.
Fetch Oldest / Fetch Newest
Click Fetch Oldest to scroll the Monitor log to the oldest log present on the server. Click Fetch Newest to see the newest created log messages.
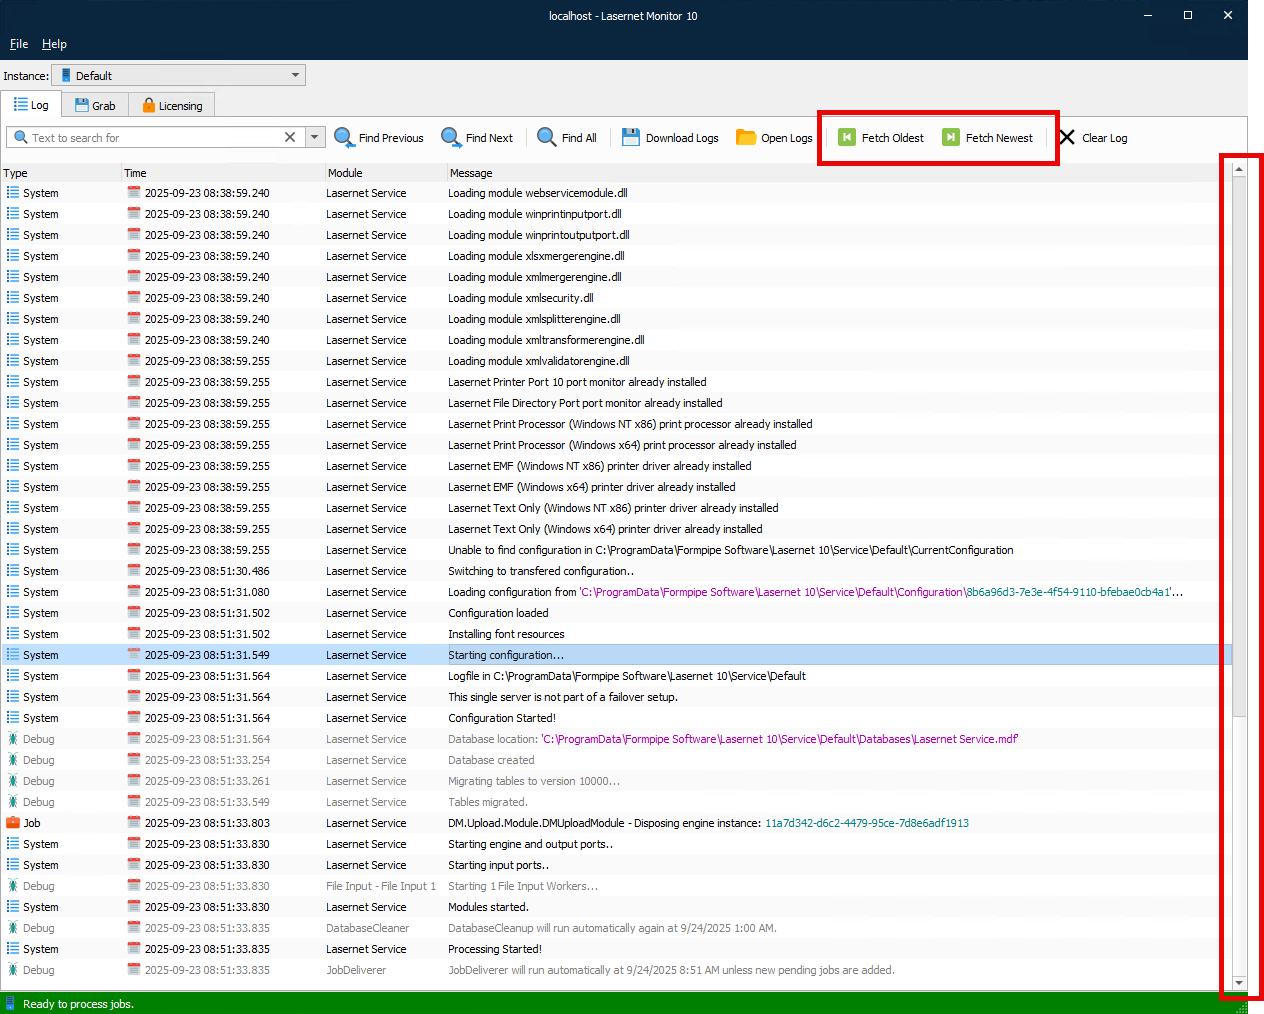
Drag the scroll bar up to fetch the previous log messages or scroll bar down to fetch the next log messages.
Clear Log
Clears log messages from the view.
Tools in the Log Window
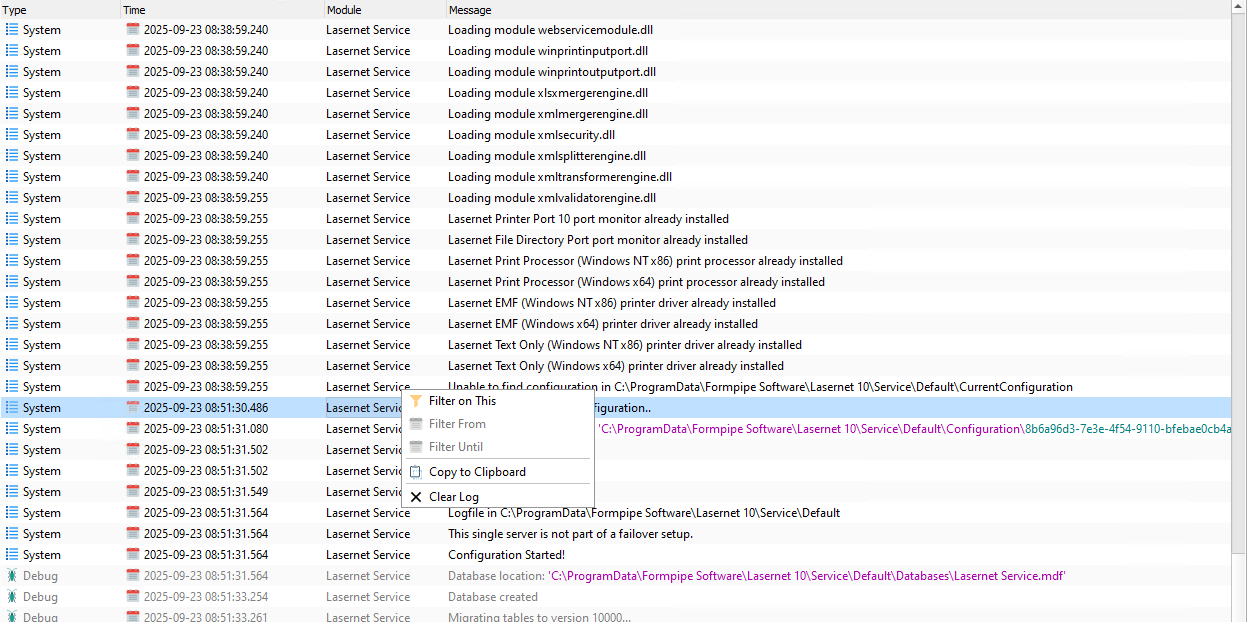
Select Copy to Clipboard to copy any message to the clipboard. You can paste the content into other apps.
Filter on This
You can right-click on any column/value in the upper pane, select Filter on This, Filter From, or Filter Until, and the selected value will be captured and inserted in the Find All dialog.
You can right click on any line or column and click Filter on This. Only lines that contain an exact match in the selected column will be listed in the log window.
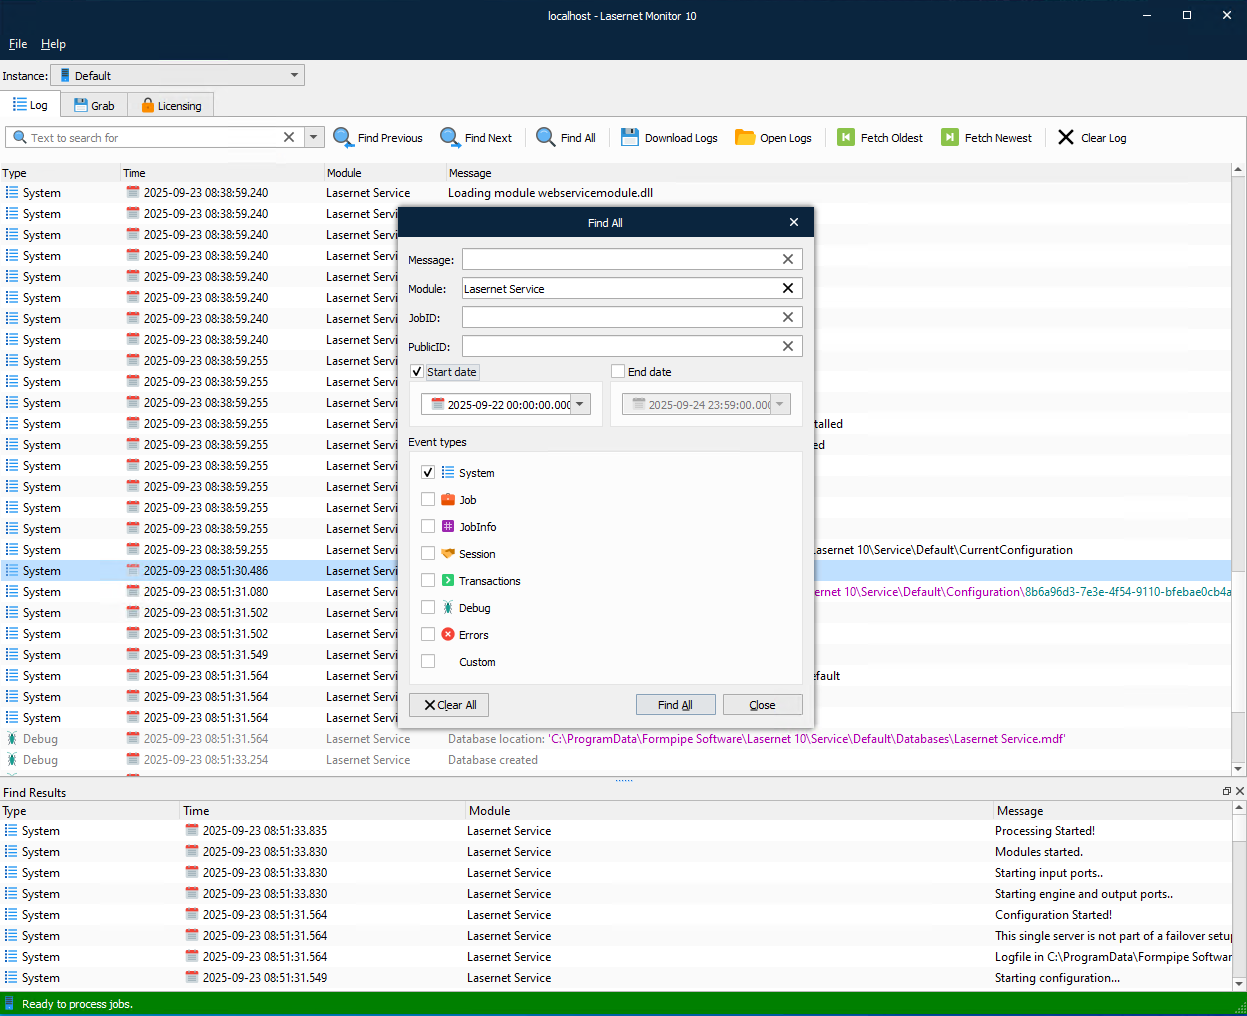
You can continue to select more columns to reduce the number of matched lines.
Copy to Clipboard
By right-clicking on a log line, the message can be copied to the clipboard. Only one line can be selected and copied at the same time.
Clear Log
Clear the currently viewed live log.
Server Status
The server status is present at the bottom of the monitor.
| Service is not running |
| Service is running, but the configuration is not loaded. Common reasons are:
|
| Service is running and ready to process jobs |



Configuring the Log
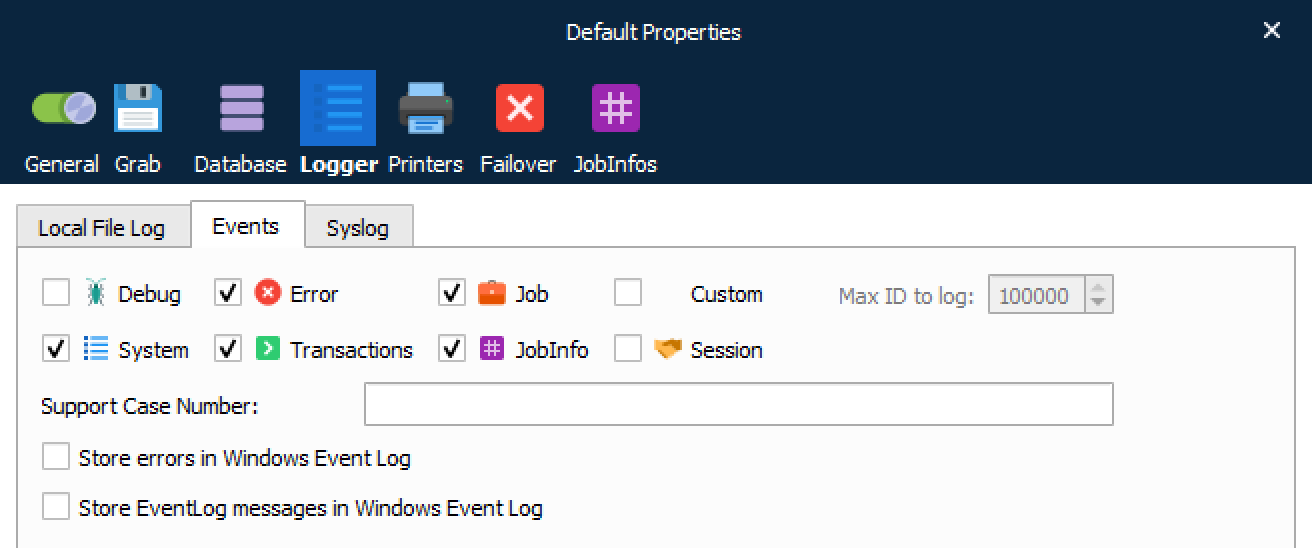
The Lasernet Developer allows you to set the options for where the log files are stored on the server as well as settings for the number of log files to be saved, file sizes and log event types.
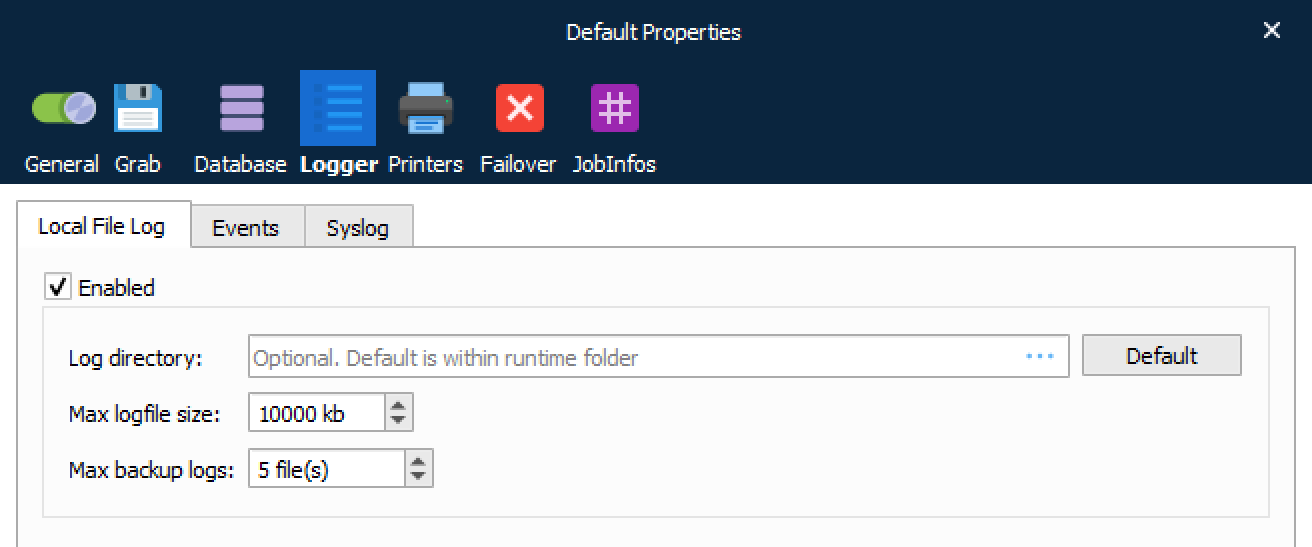
Log data can be used for debugging, error handling, job tracing, and so on. You can customize the log events you want to monitor and save, which can reduce the number of log lines saved to file and shown in the Monitor window.
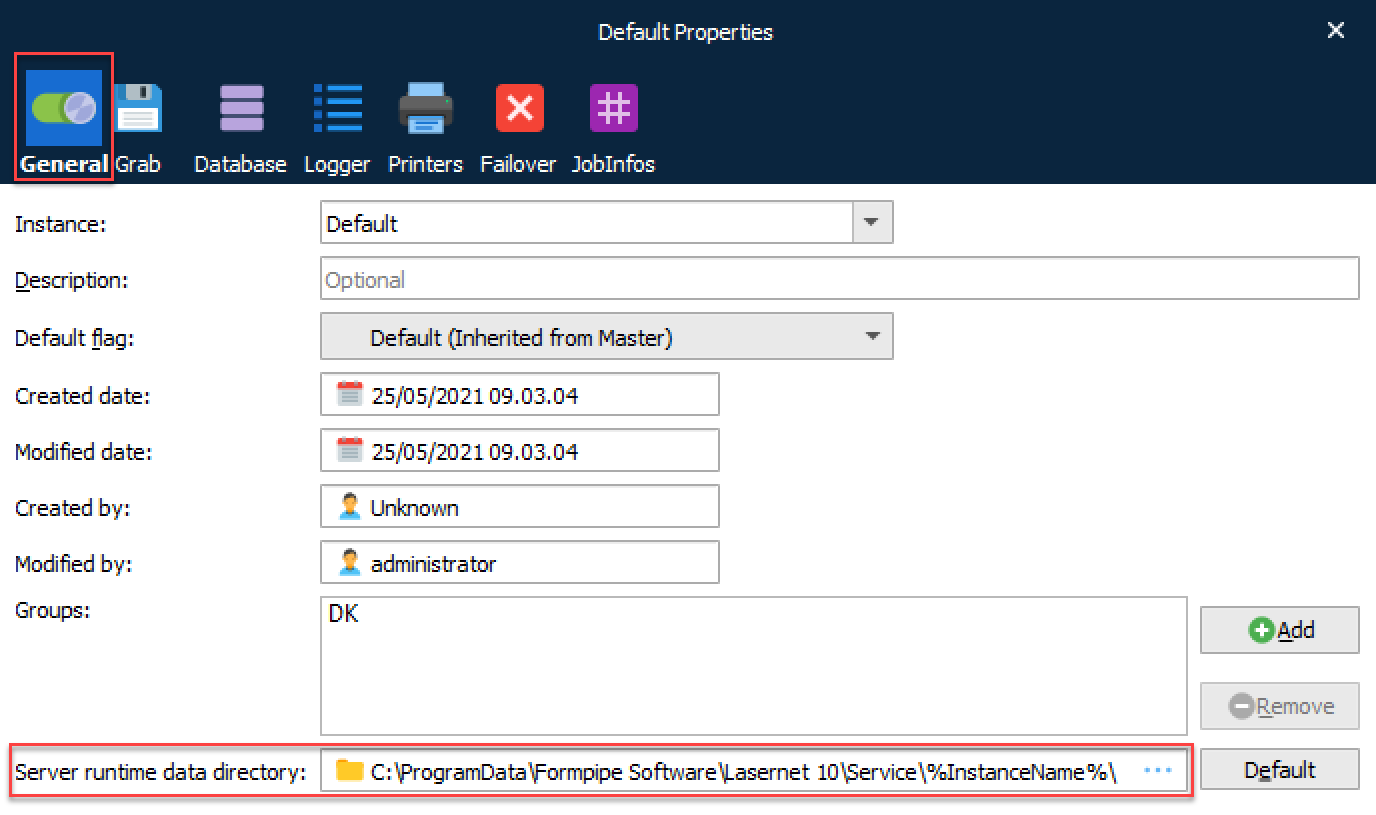
The log directory is as default set to the value of the server runtime folder and it is optional to set to a custom value. The default server runtime data directory folder can be found in the General tab of the Instance.
You can also create your log messages and levels from a script. For more information about the logger class, see the Lasernet Core Scripting Guide.
LN10-only, deprecated. These Monitor tabs have no LN11 counterpart. Formpipe Software removed them starting with Lasernet 10.7 (see below) — their absence from the LN11 guide reflects that removal, not a migration gap. Kept here for reference when supporting older Lasernet 10 installs.
Insights (Performance and Transaction Counters)
To show Performance and Transactions counters you must log in to the Lasernet Config Server and activate Insights for each server instance.
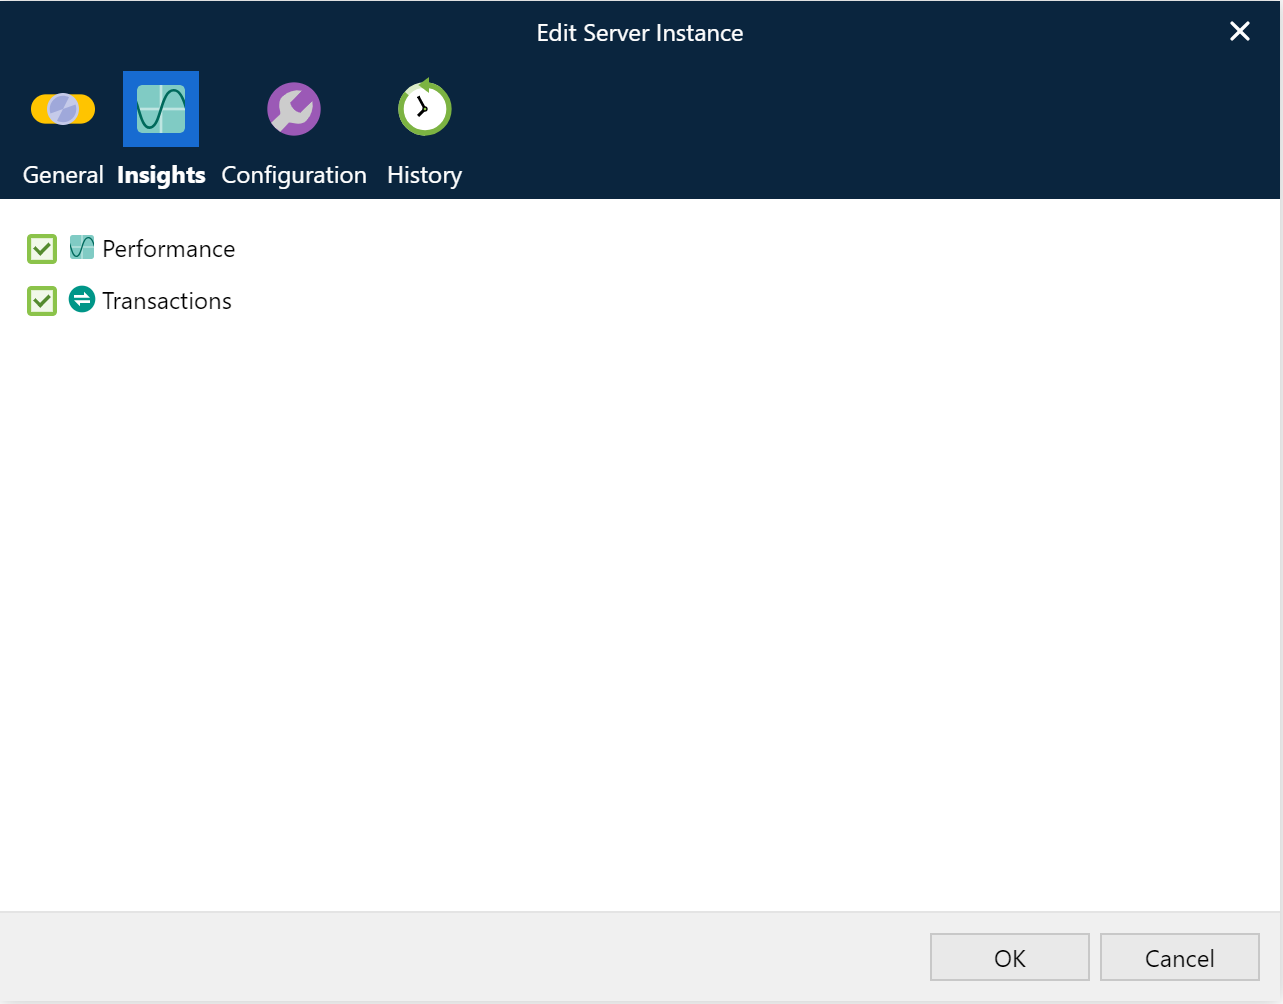
Insights will collect system details for the selected server instance when running jobs through Lasernet. To see this data, start Lasernet Monitor, select the server instance, then click the Performance tab to show system details for the latest 24 hours.
Important: You must manually restart the Lasernet Server Instance, in the Windows Services app, before the settings will have impact on the selected Lasernet Server instance.
Note:
Information for users of Lasernet 10.7 and later: Since December 2023, Microsoft Defender has been flagging the
LnMonitor.exesoftware as Trojan:Win32/Znyonm!pz or Phonzy malware. However, this is a "false positive", and Microsoft has confirmed that this is the case.For more information, see: https://support.formpipe.com/news/posts/lasernet-monitor-exe-file-detected-as-malware-by-microsoft-defender
The issue is due to the software that generates the Insights charts on the Performance and Transactions tabs. To be able to deliver security patches and fixes for users of Lasernet 10, Formpipe Software has decided to exclude the Performance and Transactions tabs, and also the functionality embedded in those tabs, from Lasernet 10.7 onwards to prevent Lasernet Monitor being flagged as malware.
Performance
Applies to: Lasernet 10.6 and earlier. See note above.
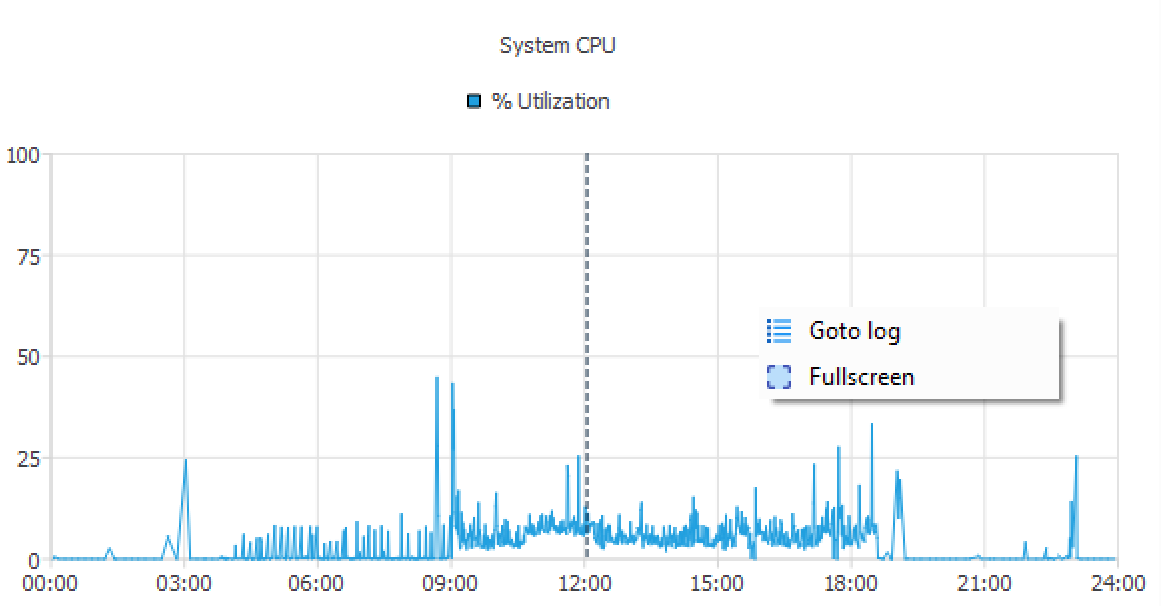
Click the Performance tab to view system details for CPU, workset, memory and handles for the latest 24 hours or since last start of Lasernet service instance.
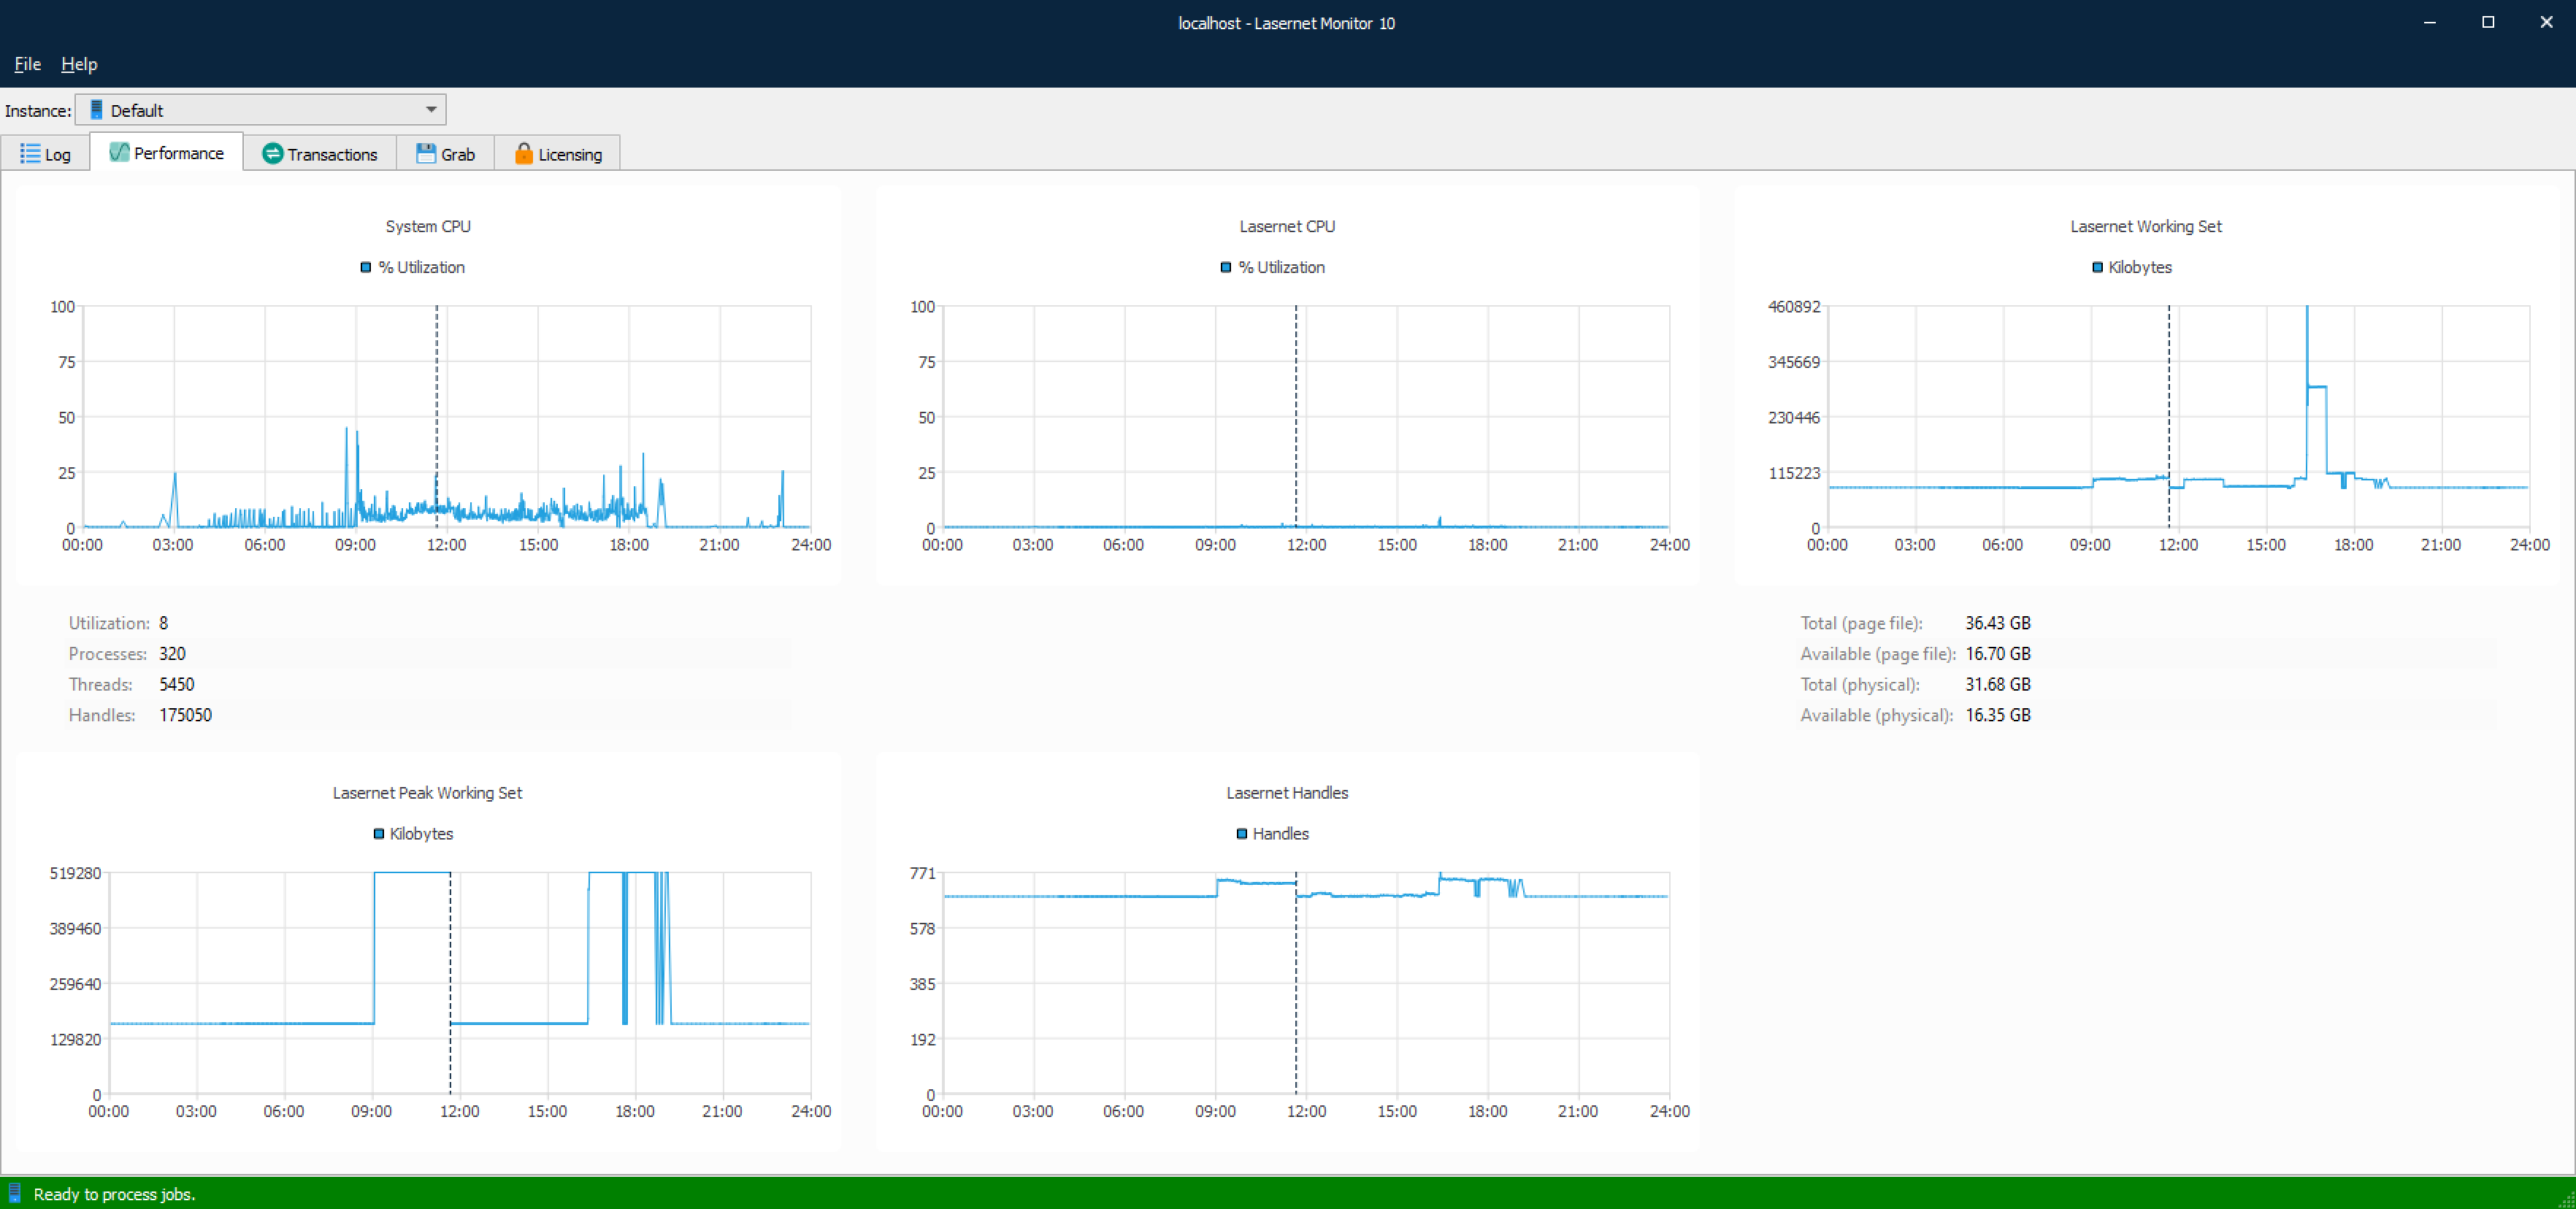
Lasernet CPU
System CPU
Lasernet Workset Set
Lasernet Memory Load
Lasernet Handles
Tip: Right click on a time stamp, in any of the graphs, to go to a specific time event in the Log tab or to show the selected graph in fullscreen mode.
Transactions
Applies to: Lasernet 10.6 and earlier. See note above.
Click the Transactions tab to view system details for number of active jobs running and the size of the job database for the latest 24 hours or since last start of Lasernet service instance.
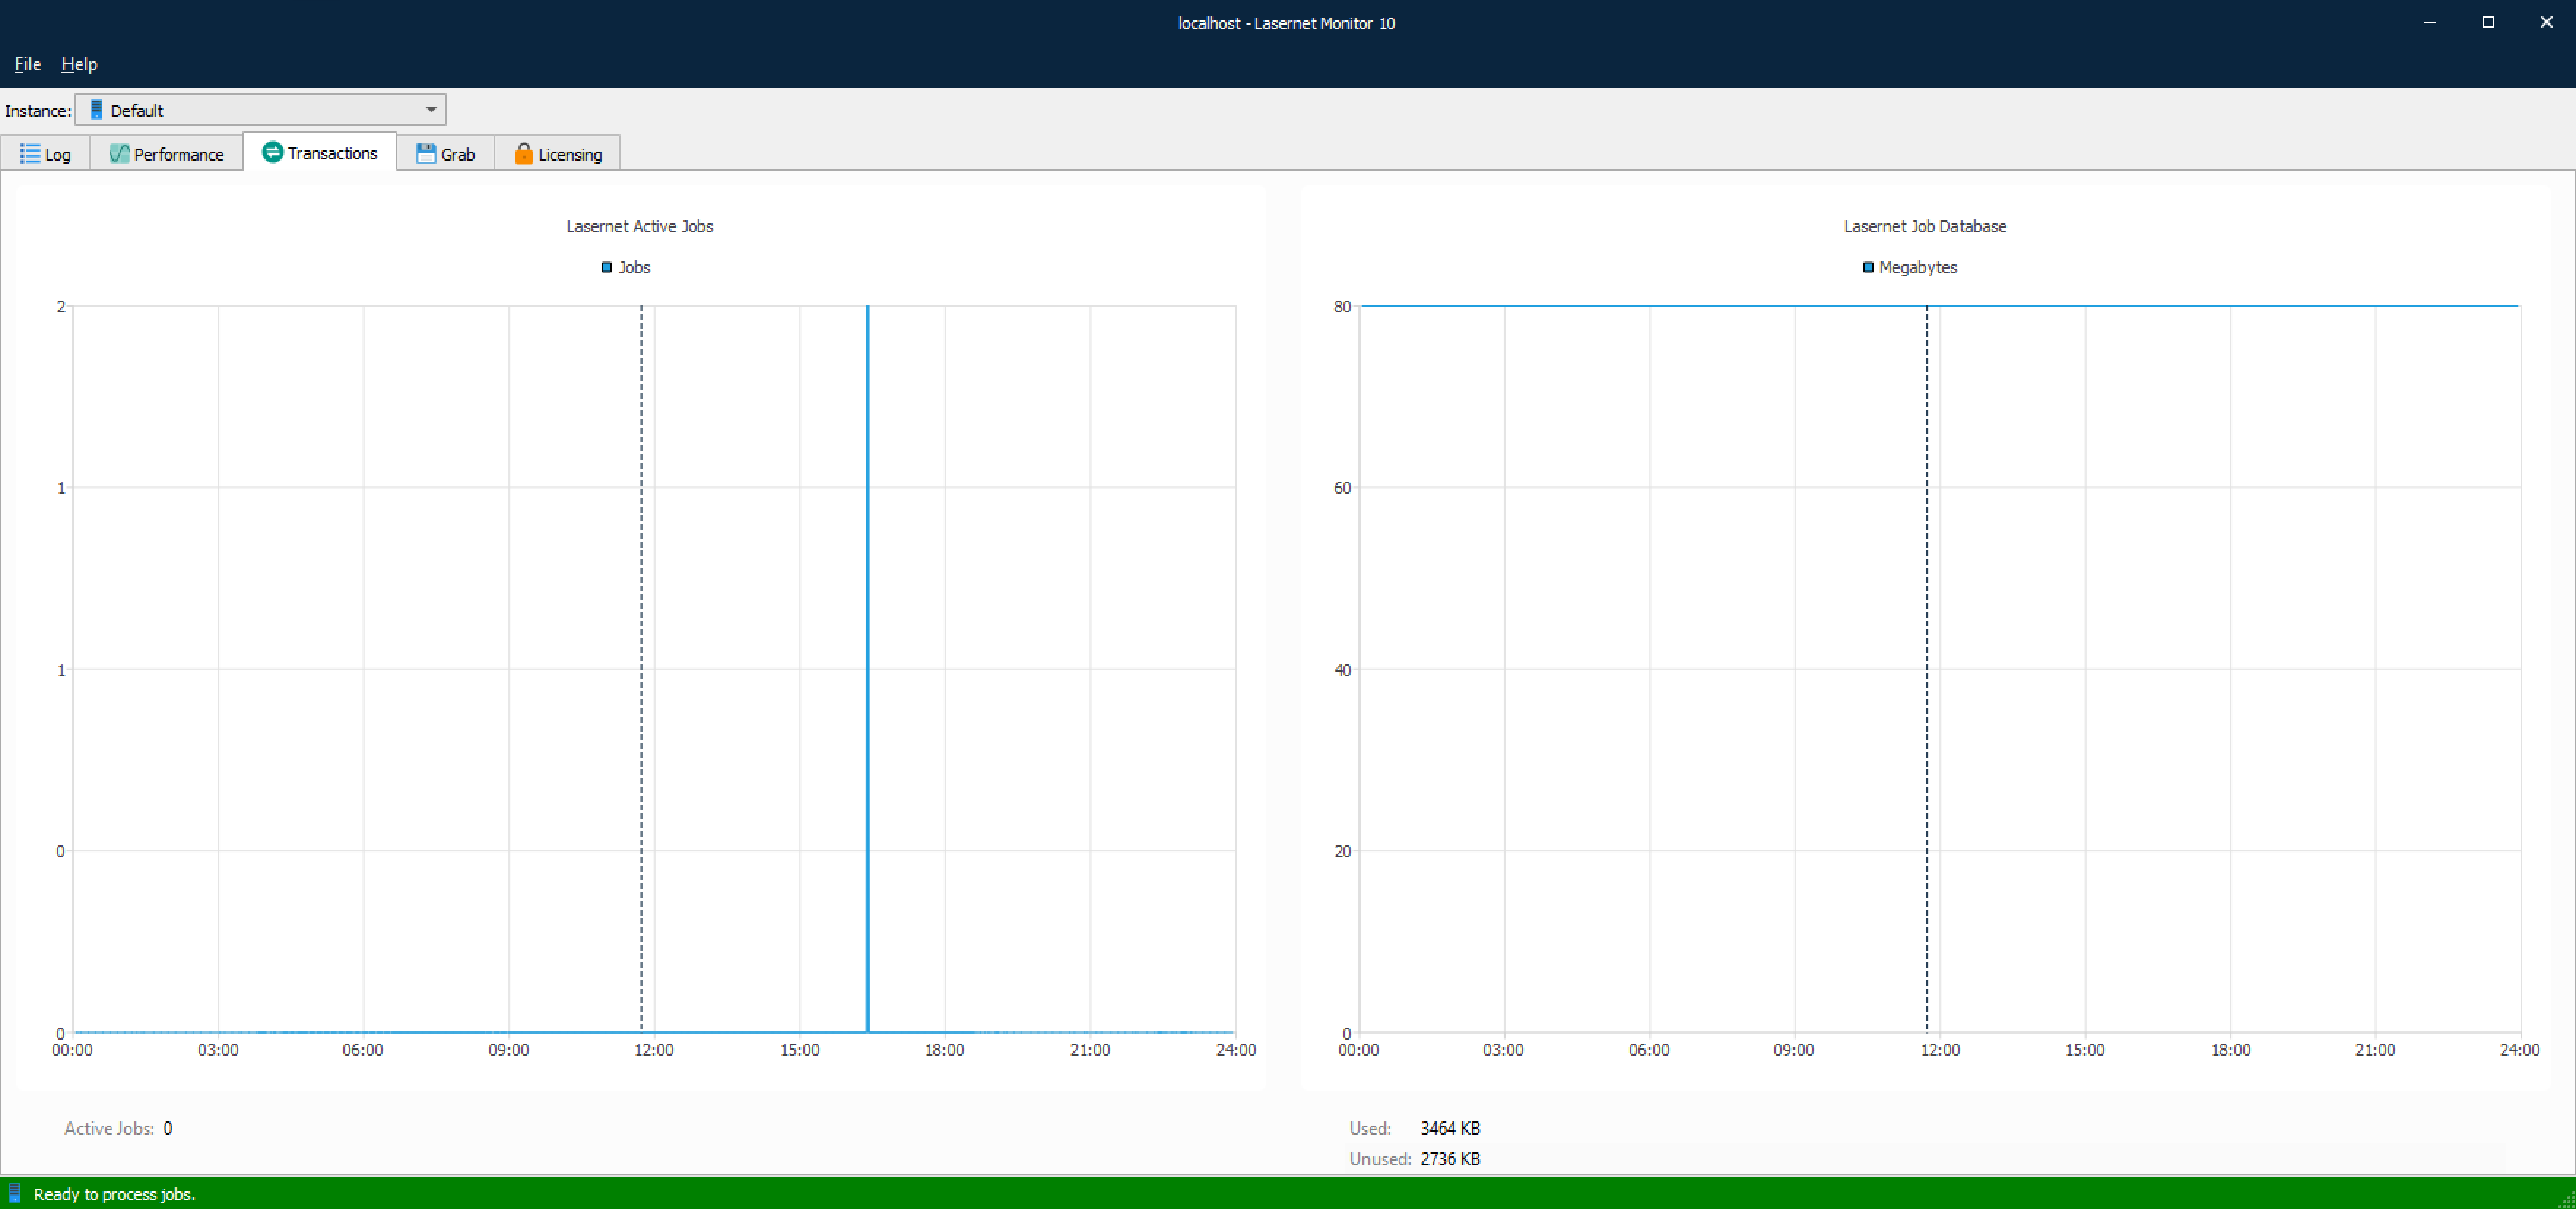
Lasernet Active Jobs
Lasernet Job Database (Monitor app only)
Moved out of Lasernet Monitor in LN11. In Lasernet Core 11, turning grab mode on and off is done in a web application instead (see the "Start and Stop Grab Mode" article), not in the Lasernet Monitor desktop app. Kept here for reference when supporting Lasernet 10 installs.
Grab
Grab mode is used by the Lasernet Server to store a copy of the job data in a user defined server grab directory. Grab files are required by the Form Editor as input data for designing forms, or by the XML Transformer Editor to modify XML data. To inspect your job data in more detail, it can be useful store a copy of it before or after it is processed through a module.
When an instance of a Lasernet service is restarted, it will use the default settings as defined in the Lasernet Developer > Server > Grab tab. When a configuration is updated to the server with the Grab setting activated, this will be the preferred mode at service start.
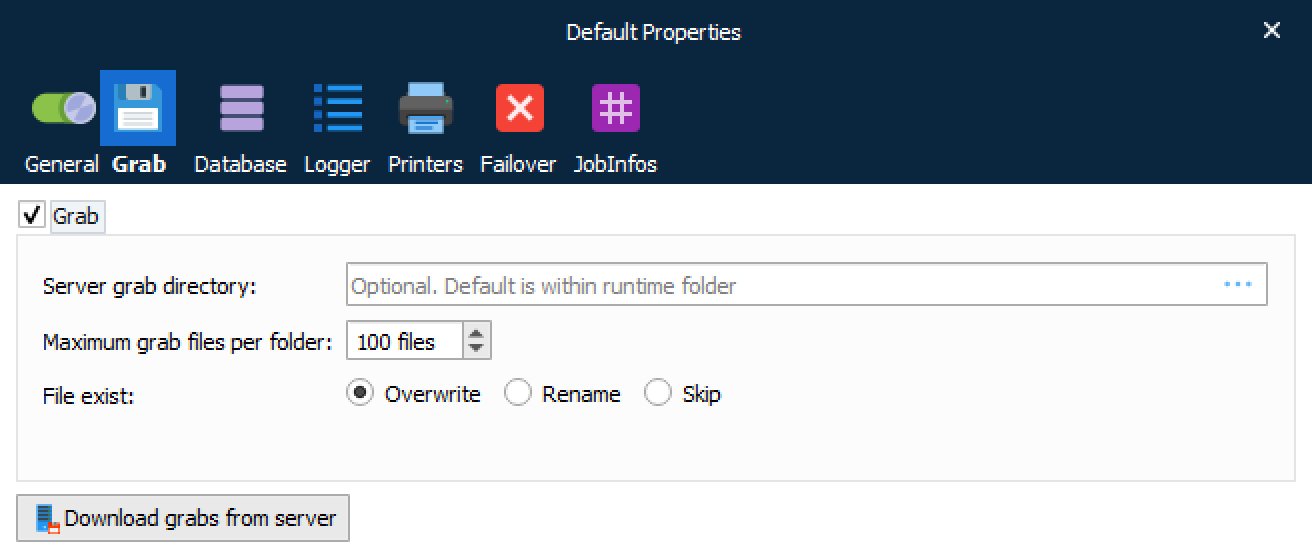
On the Grab tab of Lasernet Monitor you can temporarily activate and deactivate grab events for each module and form attached to the Overlay, Form and XML Transformer modules.
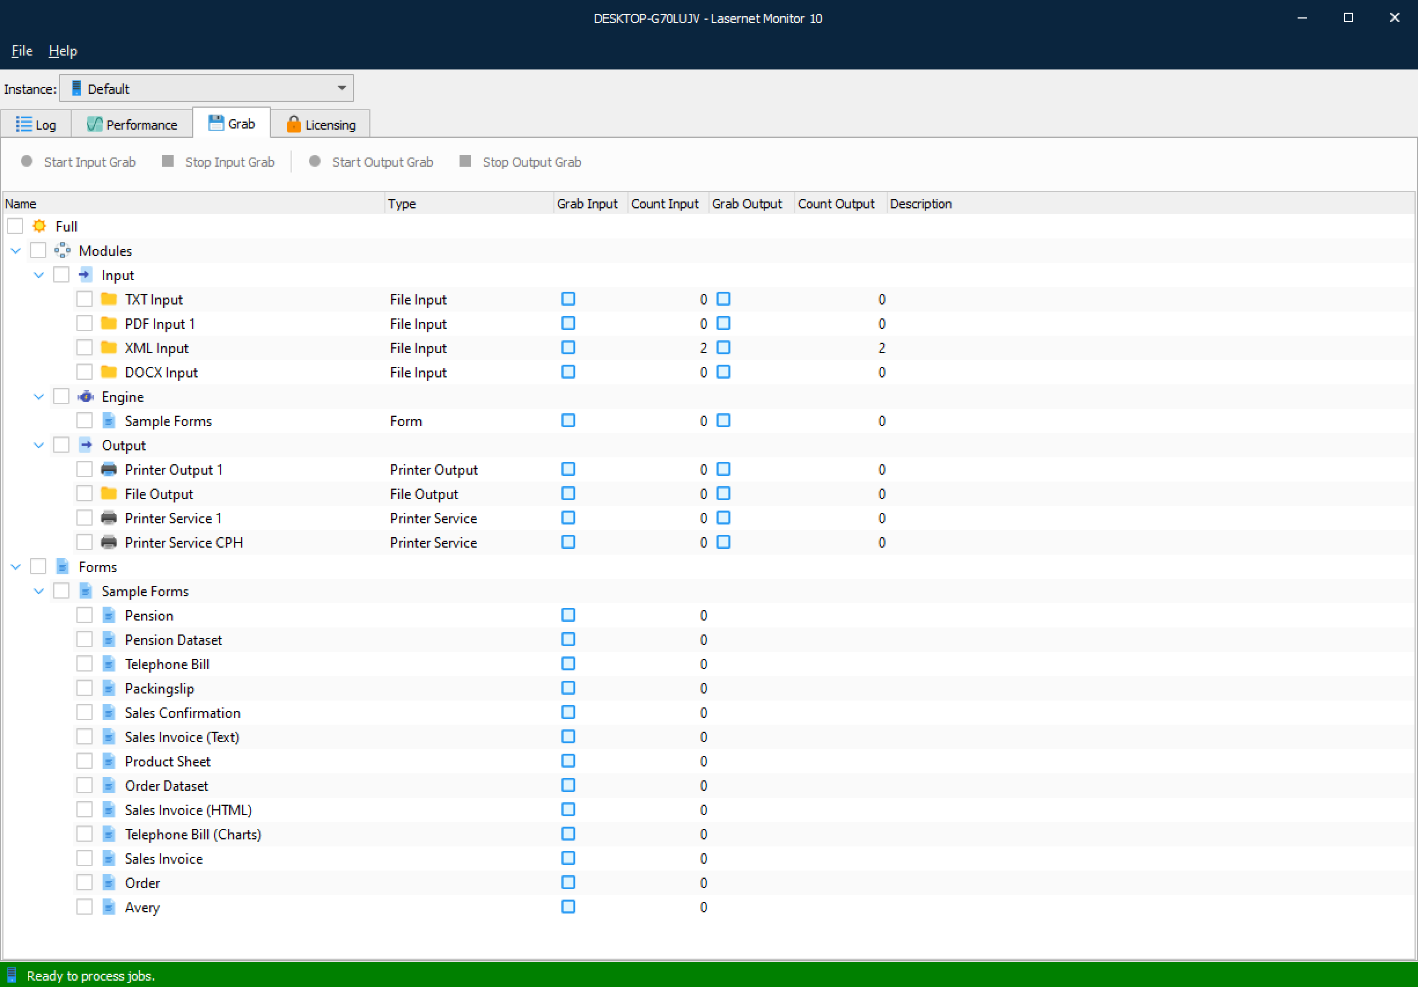
Select Full to select all modules and forms. Use the Grab toolbar to start and stop the grab mode for selected modules.
Select single or multiple modules or forms. Use the Grab toolbar to start and stop the grab mode for selected modules.
Select checkboxes in the Grab Input or Grab Output column to enable grab for a specific module or form, without using the Grab tool bar.
Columns for Count Input and Count Output will report on how many grab files the Lasernet service instance currently has stored in the grab directory for each module or form.
Grab Tool Bar
The Grab tool bar has buttons to start and stop the grab mode. The monitor does not have to run on the same computer as the Lasernet service instance to send grab mode signals.

Start Input Grab
This button will start the grab mode for selected modules or forms at grab input level. This level is before a module or form starts to process the job.
Stop Input Grab
This button will stop the grab mode for selected modules or forms at grab input level.
Start Output Grab
This button will start grab mode for selected modules at grab output level. This level is after a module has processed the job.
Stop Output Grab
This button will stop grab mode for selected modules at grab output level.